tegwin
|
| posted on 2/11/14 at 05:45 PM |

|
|
Excel... should be simple.. but its not
Anyone a dab hand at excel? I am having issues..
I basically have the daily flow rates from a river for the last 10 years. I want to average the flow by month.. So the 5000 rows of data can be
displayed in 12 rows!
So in column A I have DATE, and column B I have FLOW
What I want to do is say... Average the numbers in column B IF the month number in column A = x (where x is the month number, 1=Jan, 2=feb etc)
I can use the MONTH() function to return the month number for the dates... but how do you selectivly average based on the constraint that month must =
a constant
?
[Edited on 2/11/14 by tegwin]
------------------------------------------------------------------------------------------------------------------------
Would the last person who leaves the country please switch off the lights and close the door!
www.verticalhorizonsmedia.tv
|
|
|
|
|
r1_pete
|
| posted on 2/11/14 at 06:08 PM |
|
|
Is this what you need:
 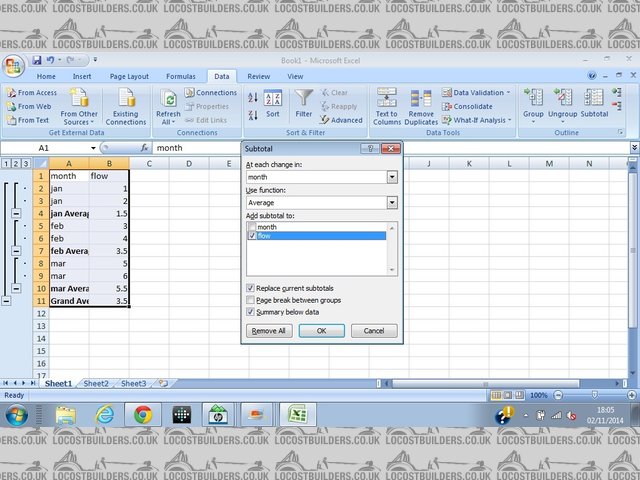
flow
Use subtotal, at each change in month use average add to flow column
|
|
|
tegwin
|
| posted on 2/11/14 at 06:12 PM |
|
|
Damn that looks a lot easier ... didnt even think to try that!
------------------------------------------------------------------------------------------------------------------------
Would the last person who leaves the country please switch off the lights and close the door!
www.verticalhorizonsmedia.tv
|
|
|
gingerprince
|
| posted on 2/11/14 at 09:54 PM |
|
|
A Pivot Table is what you need for summarising data. Select all you data and choose insert pivot table. Drag the date to the left, and flow to the
table. Then right-click on a date, choose to group by month and year. et voila.
|
|
|
Barkalarr
|
| posted on 2/11/14 at 10:34 PM |
|
|
quote:
Originally posted by gingerprince
A Pivot Table is what you need for summarising data. Select all you data and choose insert pivot table. Drag the date to the left, and flow to the
table. Then right-click on a date, choose to group by month and year. et voila.
+1 for the pivot table.
If you need a hand how to do this, let us know what version of excel you're on.
Personally, I'd use year() in one column and month() in another column unless you're only interested in the month of the year.
One tip on a pivot table is make sure all the columns have headings or else it freaks out.
[Edited on 2/11/14 by Barkalarr]
|
|
|